    data test.dat
    xcolumn 1
    ycolumn 2
    xlabel Angle
    ylabel Sine (Angle)
    plotevery 10
    histogram
    title A Histogram
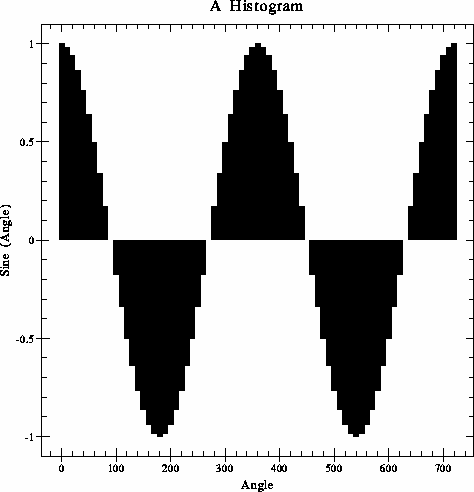
This script would produce a graph like this. Note that the base level of the histogram is auto selected to be the minimum y value. If another value is desired, simply specify the base value on the histogram command line. For example, to have the base level at zero,
    data test.dat
    xcolumn 1
    ycolumn 2
    xlabel Angle
    ylabel Sine (Angle)
    plotevery 10
    histogram 0.0
    title A Histogram
which results in a graph like:
