    data test.dat
    xcolumn 1
    ycolumn 2
    ydimension 3
    xlabel Angle
    ylabel COS( Angle )
    plot

    yrescale
    ylabel SIN ( Angle )
    noxlabel
    xnumbersize 0.
    plot
    title Two Panels
To make a graphic, you would type
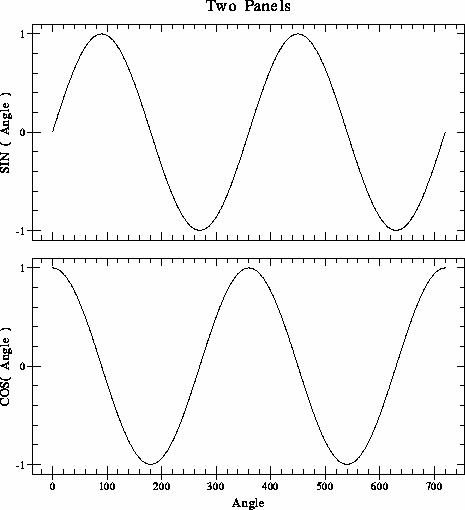
plotl multi.plot
which would produce a graph like:
